Scripture: 1 Samuel 17
Learning Objectives:
- Students will learn anything is possible if it is in God’s Plan.
- Students will learn God often uses people the world would consider unlikely to do special things for Him, perhaps to help us remember the power is God’s, not man’s.
- Students will learn it sometimes requires faith and bravery to do what God wants us to do.
- Students will learn how to graph data.
Guiding Question: How can students learn to collect and graph data?
Materials: Paper, pencils, measuring tapes
Procedure: Share the story of David and Goliath. Explain that in the story, David’s plan seemed impossible yet because it was part of God’s bigger plan, it was made possible. Nobody thought David would be able to handle Goliath but David did not give up. David had great faith in God that God would work in what He was being called to do. Emphasize how using a sling shot was a special talent that he would have developed protecting his sheep. God used this talent that He had developed in David to later defeat Goliath. Remind students that we need to have faith and be brave when God calls us to do things we are unsure of or do not understand.
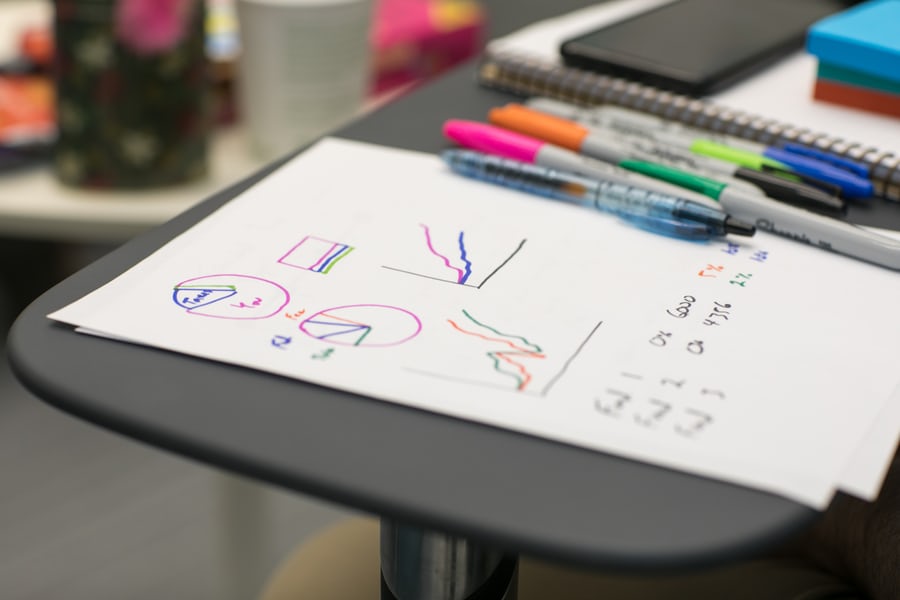
Introduce the activity. Introducing various ways to depict comparison of heights of class members – pie charts, bar graphs, and line graphs. Take the heights of the students in the class. Create chart with all data collected. Have the students create a pie chart, bar graph, and line graph of the data. Model making the graph with the students.
Additional Support: How can students learn to make a pictograph?
Supplemental Activity: Give students five options of food and have them vote for their favorite one. Record data in tally marks. Then show the students how to make a pictograph of the data. Then have students create their own pictograph.

